
Avantier’s dedication to precision engineering can be seen through custom optical dome solutions, addressing engineering challenges while maintaining structural integrity-a platform for future advancements in enclosure technology.

Avantier’s dedication to precision engineering can be seen through custom optical dome solutions, addressing engineering challenges while maintaining structural integrity-a platform for future advancements in enclosure technology.
Discover aspherical lenses and how Avantier can optimize optical performance while contributing cost savings, process stability and streamlined manufacturing in infrared lens applications.

The custom objective lens with a large numerical aperture achieves high resolution for trapping and imaging single atoms.
Aspheric bonded lenses in the manufacturing of Aspherized Achromatic Lenses effectively reduce both chromatic and spherical aberration.
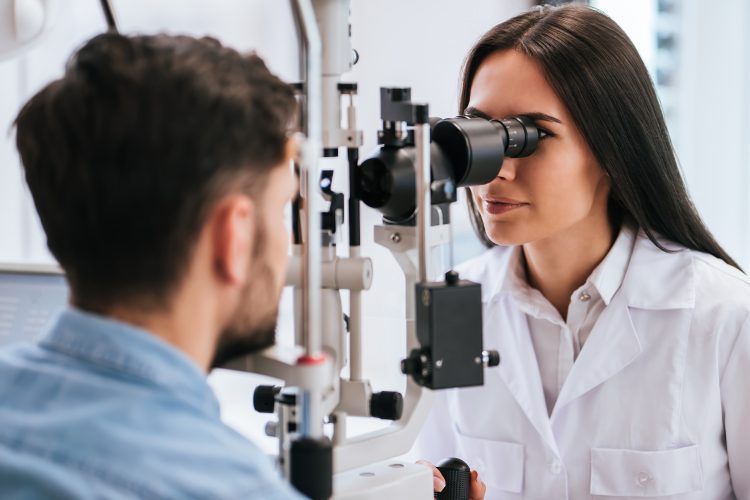
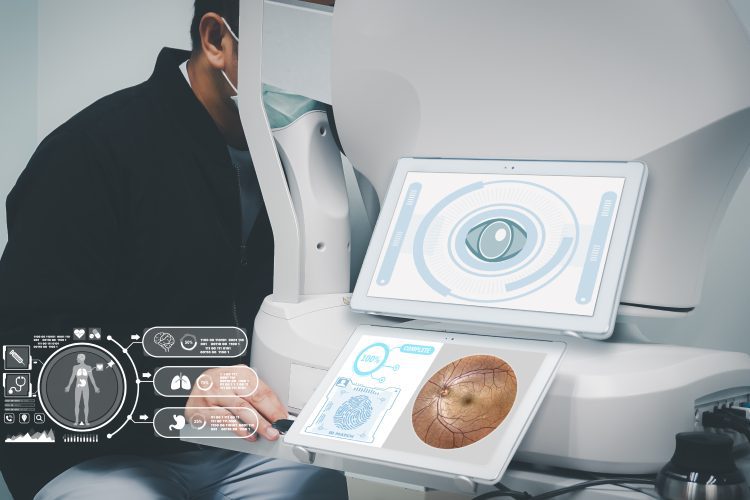
Enhance eye examinations with aspherical lenses in indirect ophthalmoscopes. Our double convex lenses correct aberrations for sharper images.
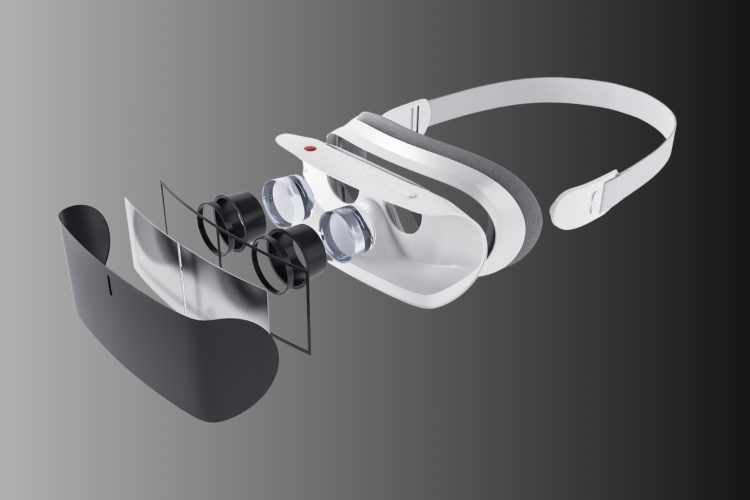
The triplet apochromat lens in VR headsets redefines immersion with minimal chromatic aberration, offering unparalleled clarity and realism.

Explore how the 50X long working distance objective maintains superior and impressive magnification performance, catering to your specific and demanding applications.
Optimize production with microlens arrays and learn how Avantier encourages clients to articulate specific needs, empowering our teams to seamlessly adapt and drive innovative solutions.
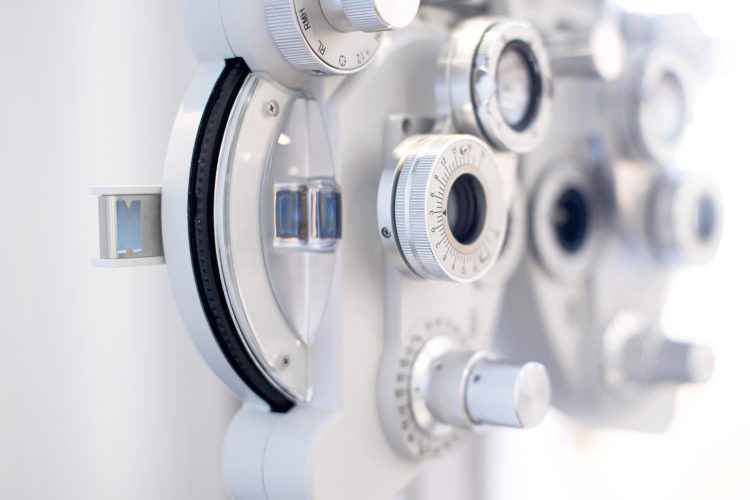
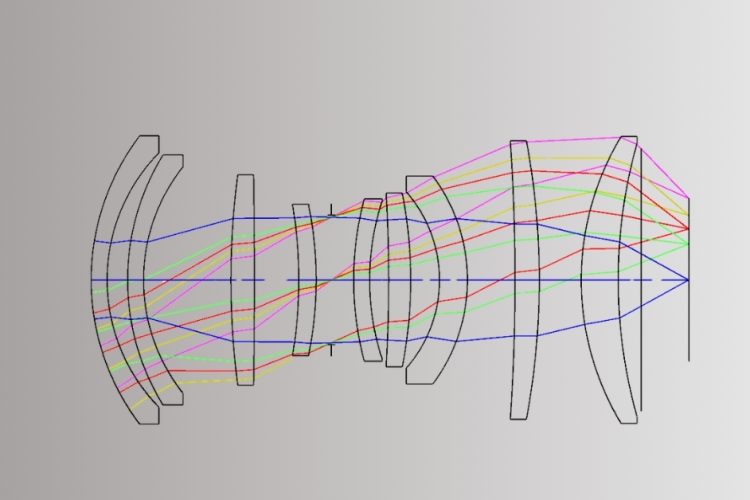
The two-aspheric cemented lens enhances optical performance for ophthalmic examinations, ensuring clear imaging.
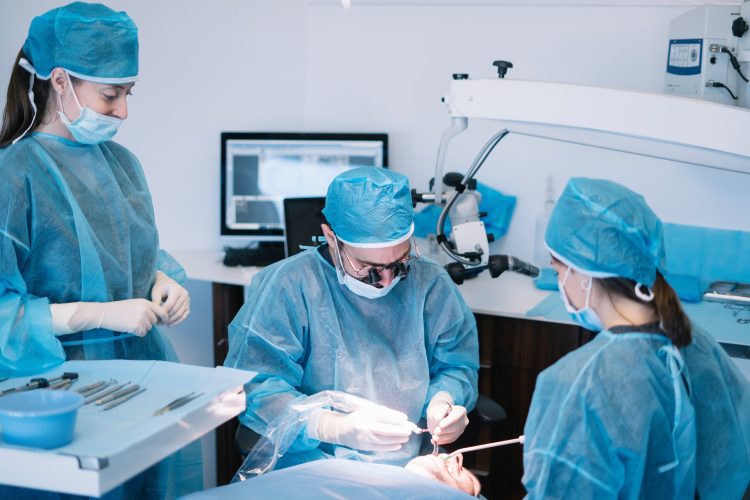
The small microscope objective lens is widely used in medical optical systems, particularly in oral cavity examinations, dentistry examinations, and dental nerve diagnostics.