
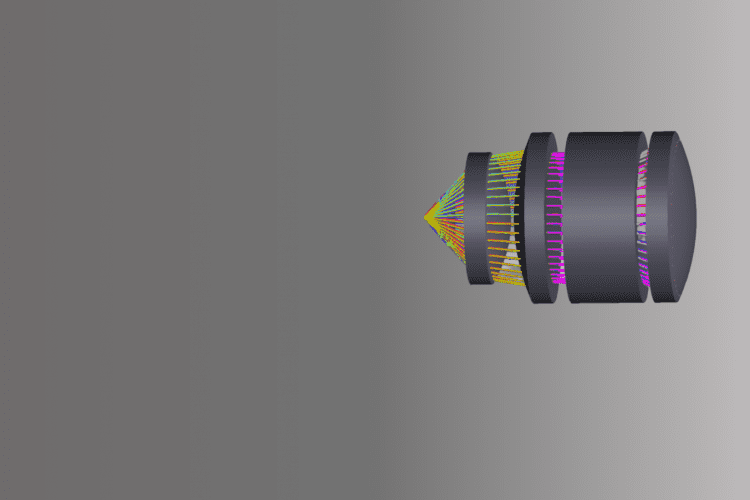
The 25X objective lens is used in Isotope Ratio Mass Spectrometer (IRMS) systems and significantly impact diverse fields such as earth science, environmental science, metallurgy, semiconductors, and materials science.

The 25X objective lens is used in Isotope Ratio Mass Spectrometer (IRMS) systems and significantly impact diverse fields such as earth science, environmental science, metallurgy, semiconductors, and materials science.
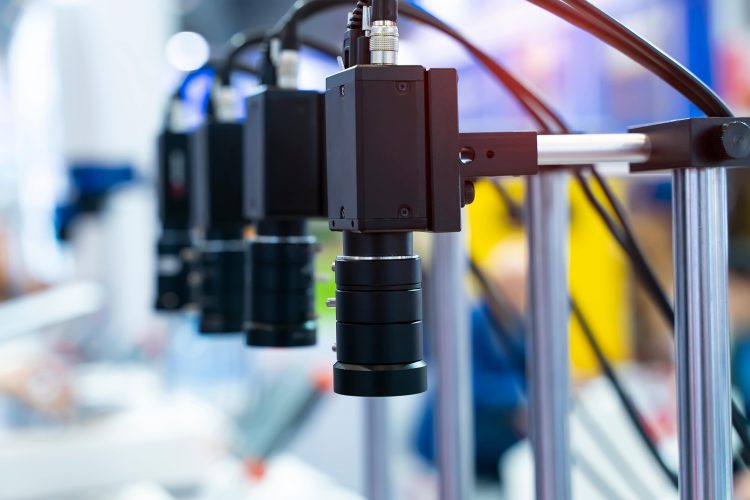
Machine vision cameras, paired with custom optics, are pivotal for precise visual perception and interpretation in industrial automation.

The dual-band camera enhances surveillance with advanced thermal imaging capabilities, revolutionizing monitoring cameras.

Photovoltaic integrated monitoring stations and wireless monitoring camera systems provide enhanced security through innovative technology.

Surveillance cameras play a pivotal role in enhancing security through vigilant monitoring of various environments.
The Robotic Intelligent Camera enhances surveillance with advanced monitoring and robust defense capabilities for heightened security.
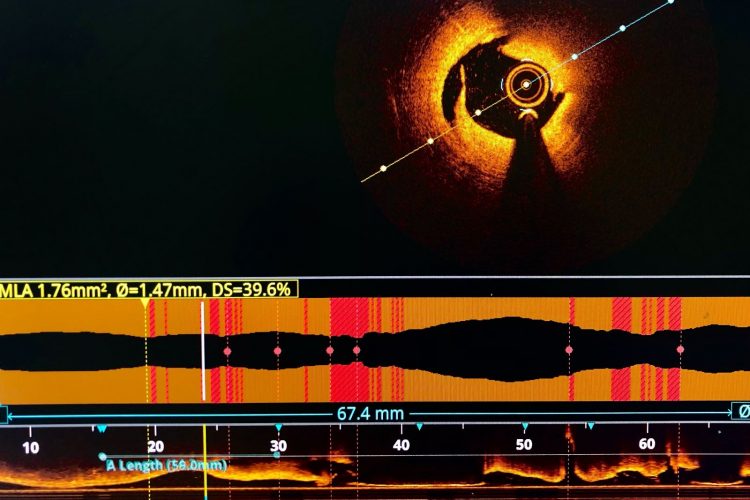
OCT, a non-contact method, is crucial for Non-Destructive Testing, ensuring thorough inspections without compromising material integrity.

Blurring is a significant source of image degradation in an imperfect imaging system. The optical system’s point spread function (PSF) describes the measure of blur in a given imaging system and is often used in image reconstruction or image recovery algorithms.
An optical drawing is a detailed plan that allows us to manufacture optical components according to a design and given specifications. When optical designers and engineers come up with a design, they condense it in an optical drawing that can be understood by manufacturers anywhere.

Resolution is a measurement of an imaging system’s ability to resolve the object which is be imaged. Test targets are typically tools that are used to check the resolution of an imaging system.