
Light is the radiant energy that manifests within the visible light spectrum, it enables us to visually comprehend the world around us. The complex interplay between light and matter shapes the branch of physics known as optics.

Light is the radiant energy that manifests within the visible light spectrum, it enables us to visually comprehend the world around us. The complex interplay between light and matter shapes the branch of physics known as optics.
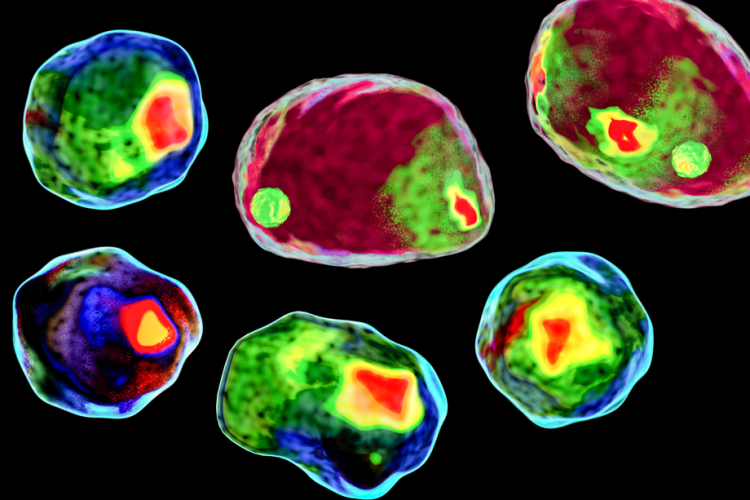
Flow cytometry relies on optimizing SNR to enhance the clarity of signals from cells using lasers and flow cytometer optics.

Spherical mirrors, either concave or convex, shape converging or diverging light rays differently to form real or virtual images; focal length, curvature and distance all affect image formation in spherical mirror applications.
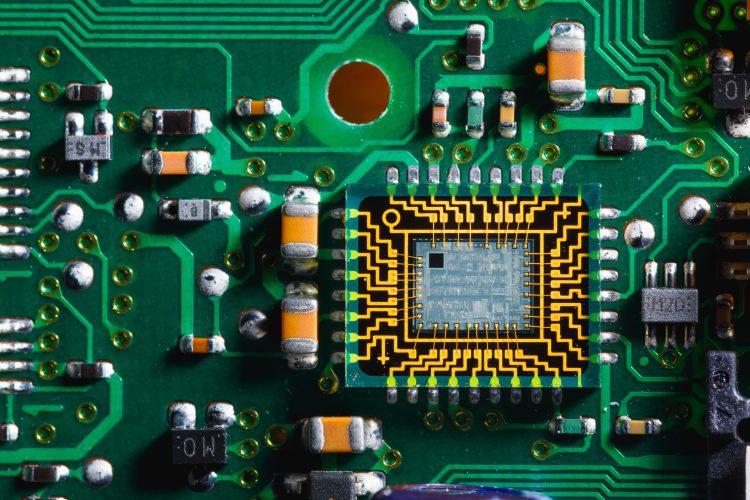
PICs, or optical ICs, use photons to power highly sensitive biosensors and revolutionize medical diagnostics.
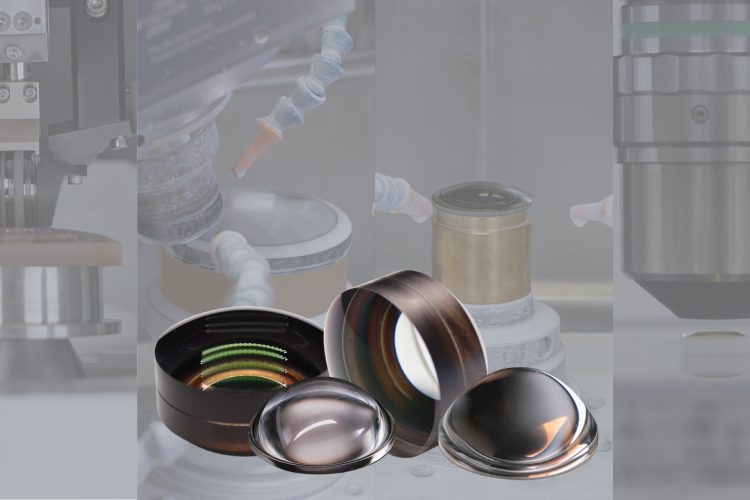
One of the most important features of aspheric lenses is their ability to correct for spherical aberration. Spherical aberration is found in all spherical lenses, such as plano-convex or double-convex lens shapes.
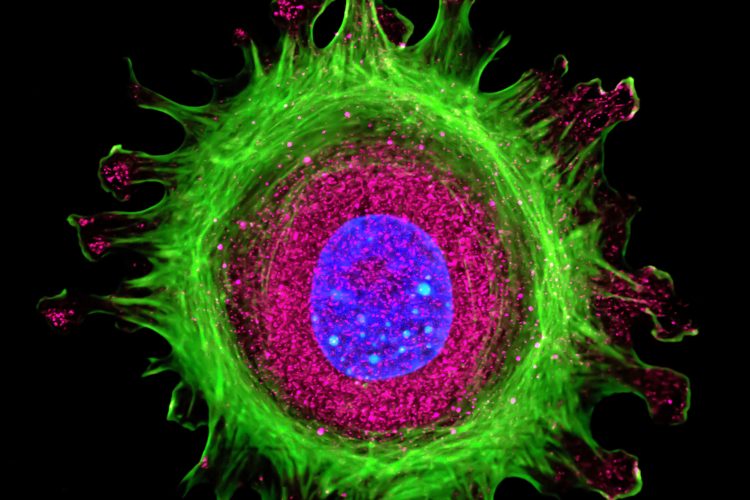
FLIM merges medical microscopy and imaging techniques to study biological processes at a molecular level, vital for biomedical research.

Achromatic lenses correct chromatic aberration, ensuring high image quality across a wide spectral range in various optical systems.

Optimize production with microlens arrays and learn how Avantier encourages clients to articulate specific needs, empowering our teams to seamlessly adapt and drive innovative solutions.
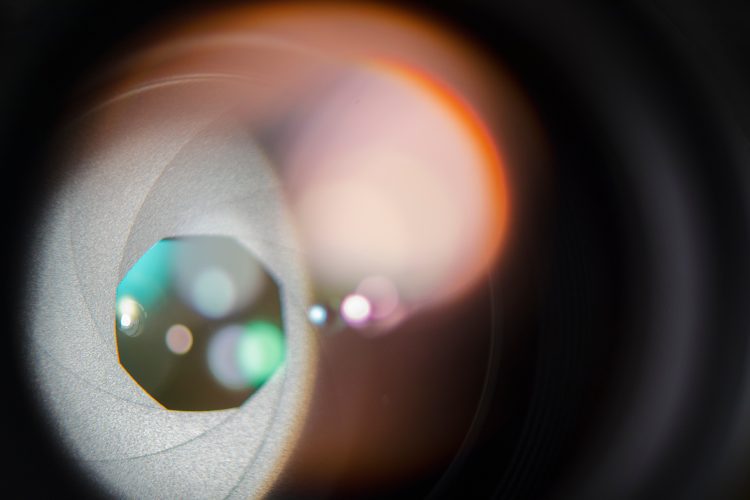
Learn how aspheric lenses revolutionize optical systems by reducing aberrations and enhancing performance, replacing spherical lenses.
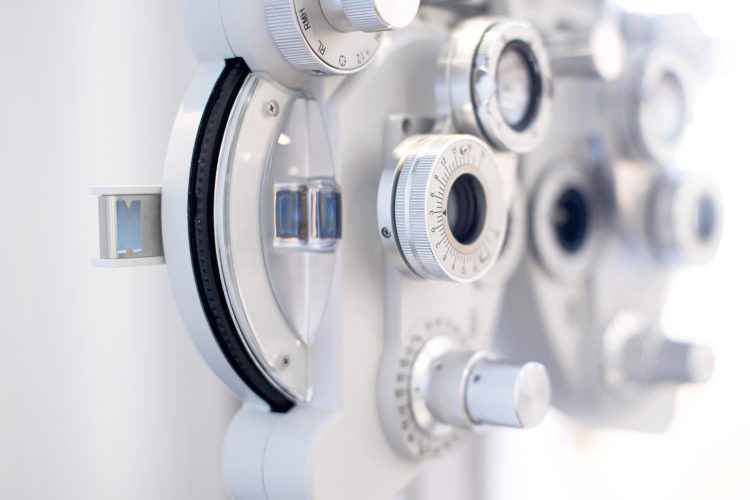
The two-aspheric cemented lens enhances optical performance for ophthalmic examinations, ensuring clear imaging.
