

Key Takeaway
When measured Modulation Transfer Function (MTF) differs from optical design predictions, the difference does not necessarily indicate a problem with the lens. Conjugate conditions, entrance pupil alignment, focus position, and measurement geometry can all influence the result, particularly toward the edge of the image field.
For optical engineers, the challenge is not simply obtaining an MTF curve, but determining whether an observed deviation reflects the lens’s optical characteristics, manufacturing variations, or the measurement configuration.
By examining tangential and sagittal MTF, spatial-frequency response, field-dependent behavior, and through-focus characteristics together, engineers can make more informed assessments of lens performance.
Introduction
MTF is a standard metric for evaluating optical imaging performance and comparing manufactured lenses against design predictions. However, even when a lens is manufactured within specification, its measured MTF may differ from the values predicted by optical design software.
Such discrepancies are not always attributable to fabrication errors or assembly tolerances. The measurement setup may introduce differences in object conjugates, pupil geometry, focus position, or other optical conditions that affect the resulting MTF.
These effects become particularly important when evaluating off-axis performance, where field-dependent aberrations and sensitivity to measurement geometry can complicate the interpretation of test results.
This article examines the factors that optical engineers should consider when investigating MTF discrepancies, using measurement examples to illustrate how different MTF characteristics can support more reliable optical performance analysis.
1. Conjugate Conditions: Why Measurement Geometry Matters
One of the first factors to verify when comparing measured and predicted MTF is whether the test configuration reproduces the lens’s intended conjugate conditions. A lens optimized for an object at infinity is generally evaluated under an infinite-to-finite conjugate configuration. In contrast, optical systems designed for finite object distances may require finite-to-finite conjugate measurements. Changing the conjugate configuration can alter the vergence of the incident light and the aberration balance of the optical system. Even after refocusing, the resulting MTF may differ from the original design prediction. The magnitude and distribution of these differences depend on factors such as optical power distribution, aperture, object distance, and field position.Finite and infinite conjugate measurement examples
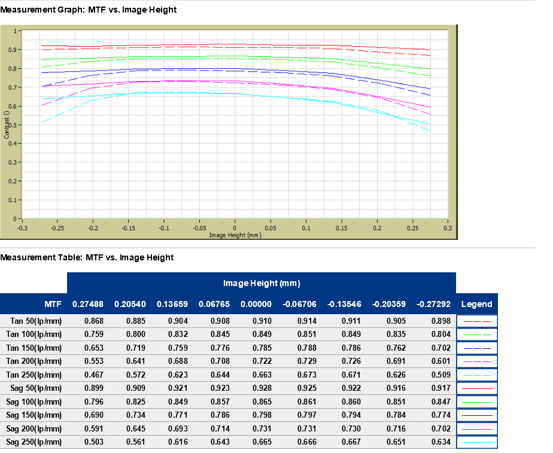
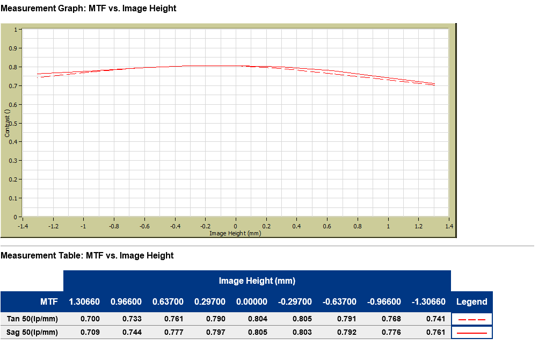
These examples illustrate MTF reporting under different conjugate configurations. Because the measurements use different spatial frequencies and image-height ranges, the curves cannot be used to quantify the effect of changing conjugate conditions.
A meaningful comparison requires testing the same optical system under clearly defined configurations and evaluating the results against corresponding optical design predictions.
Distinguishing focus shifts from aberration changes
A conjugate mismatch may introduce a shift in best focus, but refocusing does not necessarily restore the original MTF performance.
If the discrepancy is primarily caused by defocus, a through-focus measurement may reveal a shifted MTF peak with a relatively similar maximum value.
If changing the conjugate conditions also changes the aberration balance, the peak MTF itself may differ, even after the best-focus position has been adjusted.
This distinction is important when diagnosing apparent discrepancies between optical simulations and physical measurements.
What engineers should check
Before interpreting an MTF difference as a manufacturing deviation, confirm that the object conjugate, aperture, wavelength, image-field definition, and focus criterion correspond to those used in the optical design model.
2. Off-Axis MTF: What Tangential and Sagittal Separation Reveals
Off-axis MTF behavior often provides more diagnostic information than on-axis measurements alone.
While a lens may exhibit high MTF near the optical axis, its performance can decrease toward the field edge because of field-dependent aberrations, including astigmatism, coma, and field curvature.
Tangential (T) and sagittal (S) MTF curves describe contrast transfer in two orthogonal orientations relative to the field position.
Examining how these curves change across the image field helps identify directional differences in imaging performance.
Interpreting pronounced T/S separation
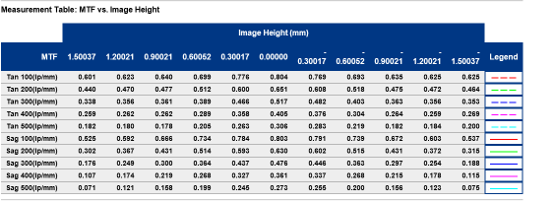
In this example, tangential and sagittal MTF exhibit different behavior toward the outer image field.
Such separation is consistent with directional differences in imaging performance and may be associated with off-axis astigmatism.
However, the separation between T and S MTF values at a single focus position is not a direct quantitative measurement of astigmatism.
The observed difference also depends on the selected image plane, spatial frequency, and contributions from other aberrations.
Interpreting smaller T/S separation
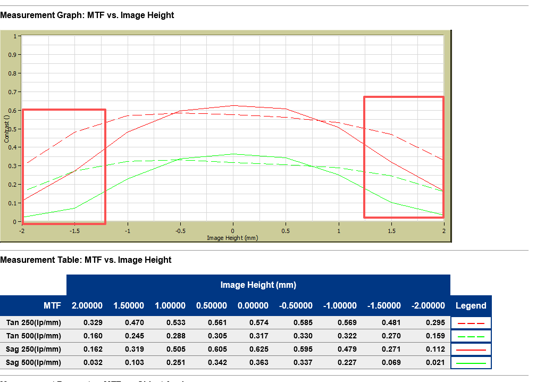
In this second example, the tangential and sagittal curves remain more closely spaced over the measured image-height range.
This indicates relatively similar contrast transfer in the two orientations under the specified measurement conditions.
However, small T/S separation at a particular image plane does not necessarily establish the absence of astigmatism or guarantee high MTF at every spatial frequency.
The two measurement examples illustrate different patterns of field-dependent performance. Because the spatial frequencies and image-height ranges differ, they should not be treated as a controlled comparison of two lenses or as evidence of an alignment improvement.
Separating optical aberrations from measurement alignment
When measured off-axis MTF differs from design expectations, entrance pupil alignment and measurement geometry deserve particular attention.
If the measurement system does not reproduce the intended pupil position and chief-ray geometry, the test rays may pass through the optical system differently from those represented in the design model.
This can influence measured off-axis performance, particularly for optical systems with large field angles or strong field-dependent aberrations.
However, an unexpected T/S difference does not independently establish pupil misalignment or lens decentering.
A more reliable investigation combines field-dependent MTF measurements with controlled alignment checks and, where available, through-focus analysis.
For example, comparing the best-focus positions of tangential and sagittal MTF at the same field position can help distinguish astigmatic focus separation from a simple change in contrast at one fixed image plane.
What engineers should check
When off-axis T/S separation is larger than predicted, verify the measurement geometry and common focus condition before attributing the difference to lens assembly or optical design limitations.
3. Spatial Frequency and Image Height: Looking Beyond a Single MTF Value
A single MTF value rarely provides sufficient information to characterize lens performance across an imaging system.
MTF depends on both spatial frequency and field position. A lens may retain relatively strong contrast transfer at low spatial frequencies while exhibiting a more pronounced decline at higher frequencies.
Likewise, performance that appears satisfactory near the optical axis may deteriorate toward the outer image field.
Evaluating frequency-dependent performance
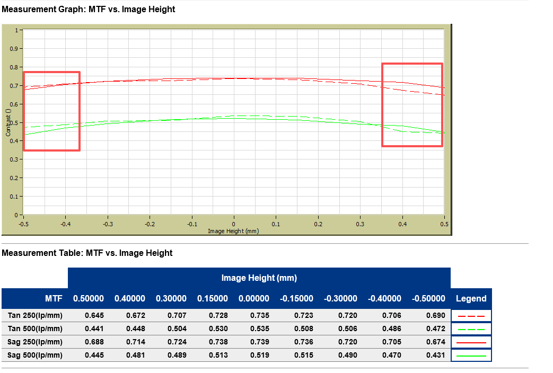
The measurement table shows that MTF can change substantially with spatial frequency and field position.
For example, measurements at 100 lp/mm and 500 lp/mm describe different aspects of the lens’s contrast-transfer performance.
Higher-frequency MTF is especially relevant when evaluating the transfer of fine image detail, although its practical importance depends on the system’s sampling characteristics and resolution requirements.
For this reason, the frequency used to define an MTF specification should be selected according to the intended imaging application rather than treated as a universal indicator of lens quality.
Why field-dependent trends matter
The shape of an MTF-versus-image-height curve can provide useful diagnostic information.
A gradual, approximately symmetric reduction toward the image-field edge may be consistent with the lens’s expected field-dependent aberration behavior.
In contrast, unexpected differences between opposite field positions can motivate further investigation of alignment, lens mounting, decentering, or other asymmetric effects.
Such patterns are not sufficient to establish a root cause on their own. They must be interpreted against the design prediction and the measurement geometry.
It is also important to distinguish between MTF obtained at the best-focus position for each field point and MTF evaluated at a common image plane.
A lens may achieve high peak MTF at multiple field positions while delivering lower contrast across the actual sensor plane because the optimum focus location varies with field.
What engineers should check
Compare MTF at application-relevant spatial frequencies and field positions, using consistent focus criteria and the same field-coordinate definitions as the design model.
4. Diffraction-Limited MTF: Understanding the Performance Reference
Diffraction-limited MTF provides a theoretical reference for evaluating the contrast-transfer capability of an optical system under specified pupil and wavelength conditions.
In an aberration-free imaging model, diffraction determines the fundamental MTF behavior associated with the optical aperture.
Real optical systems may depart from this reference because of residual aberrations, fabrication tolerances, assembly errors, or alignment effects.
Comparing optical performance against the diffraction limit
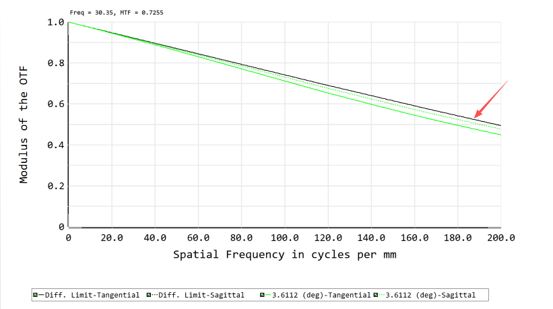
The graph illustrates the relationship between an optical system’s evaluated MTF and its diffraction-limited reference over a range of spatial frequencies.
Where the optical-system curves approach the diffraction-limited reference, the calculated performance is close to the ideal diffraction-limited response for the specified conditions.
A greater separation may indicate a larger contribution from residual aberrations in the evaluated optical model.
However, the significance of the difference depends on the wavelength, pupil conditions, field position, and focus setting used in the analysis.
A diffraction-limited reference is therefore most useful when compared with an optical model or measurement obtained under equivalent conditions.
It is also important to distinguish between calculated MTF and measured MTF. Agreement between a design calculation and its diffraction-limited reference does not guarantee that manufactured lenses will achieve the same performance.
What engineers should check
Use diffraction-limited MTF as a condition-specific optical reference, not as a standalone acceptance criterion for a manufactured lens.
5. Through-Focus MTF: Distinguishing Focus Error from Field-Dependent Aberrations
A fixed-focus MTF curve describes imaging performance at a selected image plane, but it does not necessarily show where each field position achieves its maximum contrast transfer.
Through-focus MTF adds another dimension by recording MTF as the image plane is shifted through a defined focus range.
This is particularly useful when investigating differences between measured and predicted performance.
Best-focus shifts and aberration balance
Several distinct behaviors can be examined through a focus scan.
A shift in the MTF peak position may indicate a difference between the assumed and actual focus locations.
A reduction in peak MTF may suggest that the discrepancy is not explained by defocus alone and that additional aberrations or measurement effects should be investigated.
A difference between tangential and sagittal best-focus positions can provide evidence of astigmatic focus separation.
A systematic change in best-focus position across the field can provide insight into field curvature.
Importantly, these behaviors should be evaluated at defined spatial frequencies and under consistent measurement conditions.
Best-focus MTF versus common-plane MTF
For many imaging applications, the sensor is fixed at a single image plane.
Consequently, evaluating the maximum achievable MTF separately at every field position can overstate the performance available across the actual sensor.
Optical engineers should therefore consider both the best-focus MTF and the MTF achieved at the intended common image plane.
This comparison helps clarify whether reduced edge performance results primarily from field-dependent focus displacement or from limitations in the achievable MTF at that field position.
What engineers should check
When a measured MTF result is unexpectedly low, perform a controlled focus scan before concluding that the lens has an intrinsic resolution limitation.
6. A Practical Framework for Investigating MTF Discrepancies
An MTF deviation becomes more useful diagnostically when it is evaluated as a pattern rather than as an isolated numerical difference.
The relationship between spatial frequency, field position, T/S orientation, and focus setting can help narrow the range of possible causes.
The following table summarizes several common observations and appropriate next steps.
| Observed behavior | Possible factors | Recommended investigation |
| MTF is lower than predicted across most field positions | Focus mismatch, test conditions, or reduced optical performance | Check the common focus criterion and compare through-focus peak MTF |
| On-axis MTF agrees with prediction, but off-axis MTF is lower | Field-dependent aberrations or measurement geometry | Verify entrance pupil alignment and compare field-dependent predictions |
| Pronounced T/S separation develops toward the field edge | Astigmatic behavior, other asymmetric aberration effects, or measurement alignment | Compare T/S through-focus responses at matching field positions |
| Opposite field positions show unexpected MTF asymmetry | Decentering, tilt, mounting, or measurement alignment | Check field symmetry and repeat measurements after controlled alignment verification |
| Low-frequency MTF is relatively high, but high-frequency MTF is reduced | Frequency-dependent contrast loss associated with aberrations or other system effects | Compare spatial-frequency response against equivalent design predictions |
| MTF changes significantly between repeated measurements | Focus repeatability, mounting, vibration, illumination, or environmental variation | Perform repeated measurements under controlled conditions |
These relationships are intended to guide investigation rather than identify manufacturing defects directly.
Measurement repeatability as a diagnostic tool
Repeatability testing is essential when small differences in MTF influence engineering decisions.
Two types of repeated measurements should be distinguished.
Measurements taken without disturbing the optical setup primarily indicate short-term measurement stability.
Measurements taken after removing, reinstalling, and realigning the lens also include contributions from mounting and alignment repeatability.
Separating these effects helps engineers determine whether observed variation originates from the measurement process or reflects reproducible differences between optical samples.
Matching the design and measurement conditions
Before making a design or manufacturing decision based on MTF differences, the following conditions should be verified:
- Object and image conjugates
- Wavelength or spectral weighting
- Aperture and effective pupil geometry
- Spatial frequency and field-coordinate definitions
- Tangential and sagittal orientation
- Focus criterion and image-plane position
- Measurement stability and repeatability
Only after these conditions are sufficiently aligned does a direct comparison between measured and simulated MTF become technically meaningful.
Conclusion
MTF measurement accuracy is not determined by the measurement equipment alone. It also depends on how closely the test configuration represents the optical conditions used in the lens design and how the resulting data are interpreted.
For optical engineers, particular attention should be given to conjugate conditions, entrance pupil alignment, field-dependent T/S behavior, spatial-frequency response, and focus position.
The most informative analysis does not rely on a single MTF value. Instead, it combines measurements across field positions, spatial frequencies, and focus settings to distinguish expected optical behavior from potential measurement-related effects.
A systematic design-to-test comparison can help engineers identify meaningful performance deviations, avoid incorrect conclusions about lens quality, and make better-informed decisions during optical design validation and manufacturing.
Need to Evaluate MTF Performance for a Custom Optical System?
Our engineering team supports custom lens design, optical performance analysis, and testing based on application-specific requirements.
Whether you are comparing design predictions with measured performance or evaluating field-dependent image quality, we can help you assess the optical requirements and measurement considerations relevant to your application.



WE CAN HELP YOU!
Contact us NOW for sales & expert advice.